1. Data

Land Use is shorthand for Land Use, Land-Use Change and Forestry (LULUCF). The sector is both a source and sink of greenhouse gases. LULUCF is subject to fluctuations and revisions as methodologies change. What is Mt CO₂-e? Emissions are a combination of gases. Most are Carbon Dioxide (CO₂). The other gases are measured as a Carbon Dioxide equivalent (CO₂-e) based on the amount of heat they trap in the atmosphere. They’re measured in Million Tonnes (Mt).

Land Use emissions target

AUS

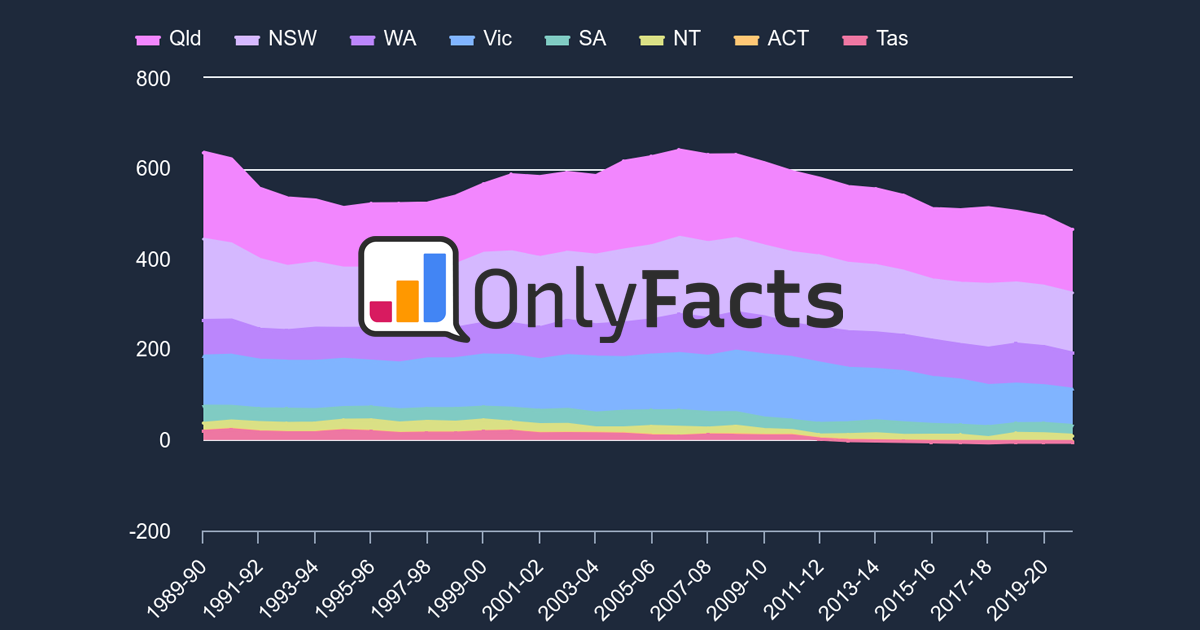
Emissions History - Mt CO₂-e

Source: DCCEEW Quarterly updates via OnlyFacts | Updated: 01-09-24

Data

AUS

Rolling 12 month total

YEAR

Mt CO₂-e

v PREV YEAR

v 2005

Jun 05 75.0 - 0
Sep 05 82.8 - 10.5%
Dec 05 90.7 - 21.0%
Mar 06 98.4 - 31.3%
Jun 06 106.2 41.7% 41.7%
Sep 06 99.7 20.3% 32.9%
Dec 06 93.1 2.6% 24.2%
Mar 07 86.7 11.9% 15.6%
Jun 07 80.2 24.5% 7.0%
Sep 07 76.5 23.2% 2.1%
Dec 07 72.9 21.7% 2.8%
Mar 08 69.4 19.9% 7.4%
Jun 08 65.8 17.9% 12.2%
Sep 08 63.7 16.8% 15.0%
Dec 08 61.6 15.5% 17.9%
Mar 09 59.3 14.6% 20.9%
Jun 09 57.2 13.0% 23.6%
Sep 09 58.8 7.7% 21.6%
Dec 09 60.3 2.1% 19.6%
Mar 10 61.8 4.1% 17.6%
Jun 10 63.3 10.6% 15.6%
Sep 10 54.9 6.5% 26.7%
Dec 10 46.5 22.8% 37.9%
Mar 11 38.3 37.9% 48.9%
Jun 11 30.1 52.5% 59.9%
Sep 11 23.5 57.2% 68.7%
Dec 11 16.9 63.6% 77.4%
Mar 12 10.5 72.5% 85.9%
Jun 12 4.1 86.5% 94.6%
Sep 12 6.7 71.4% 91.0%
Dec 12 9.4 44.7% 87.5%
Mar 13 12.0 13.4% 84.1%
Jun 13 14.6 259.4% 80.6%
Sep 13 12.0 78.4% 84.0%
Dec 13 9.4 0.1% 87.5%
Mar 14 6.8 43.0% 90.9%
Jun 14 4.2 71.0% 94.4%
Sep 14 0.729 93.9% 99.0%
Dec 14 -2.8 129.6% 103.7%
Mar 15 -6.2 190.9% 108.3%
Jun 15 -9.7 328.3% 112.9%
Sep 15 -22.4 3176.8% 129.9%
Dec 15 -35.2 1171.7% 147.0%
Mar 16 -47.9 673.4% 163.9%
Jun 16 -60.5 527.1% 180.7%
Sep 16 -52.7 135.0% 170.3%
Dec 16 -44.9 27.5% 159.9%
Mar 17 -37.1 22.5% 149.5%
Jun 17 -29.4 51.4% 139.2%
Sep 17 -36.7 30.4% 148.9%
Dec 17 -44.0 2.0% 158.7%
Mar 18 -51.1 37.8% 168.2%
Jun 18 -58.4 98.6% 177.9%
Sep 18 -59.7 62.6% 179.6%
Dec 18 -61.0 38.5% 181.3%
Mar 19 -62.2 21.7% 183.0%
Jun 19 -63.5 8.8% 184.7%
Sep 19 -62.9 5.4% 183.9%
Dec 19 -62.3 2.2% 183.1%
Mar 20 -61.8 0.6% 182.5%
Jun 20 -61.2 3.6% 181.7%
Sep 20 -68.2 8.4% 190.9%
Dec 20 -75.1 20.6% 200.1%
Mar 21 -81.7 32.1% 209.0%
Jun 21 -88.5 44.6% 218.1%
Sep 21 -88.5 29.8% 218.0%
Dec 21 -88.5 17.8% 218.0%
Mar 22 -88.4 8.2% 217.9%
Jun 22 -88.4 0.2% 217.9%
Sep 22 -88.4 0.1% 217.9%
Dec 22 -88.4 0.1% 217.9%
Mar 23 -88.4 0.0% 217.9%
Jun 23 -88.4 0 217.9%
Sep 23 -88.4 0 217.9%
Dec 23 -88.4 0 217.9%
Mar 24 -88.4 0 217.9%
Jun 24 -88.4 0 217.9%

Source: DCCEEW Quarterly updates via OnlyFacts | Updated: 01-09-24

News

Sign up to the free weekly climate data briefing