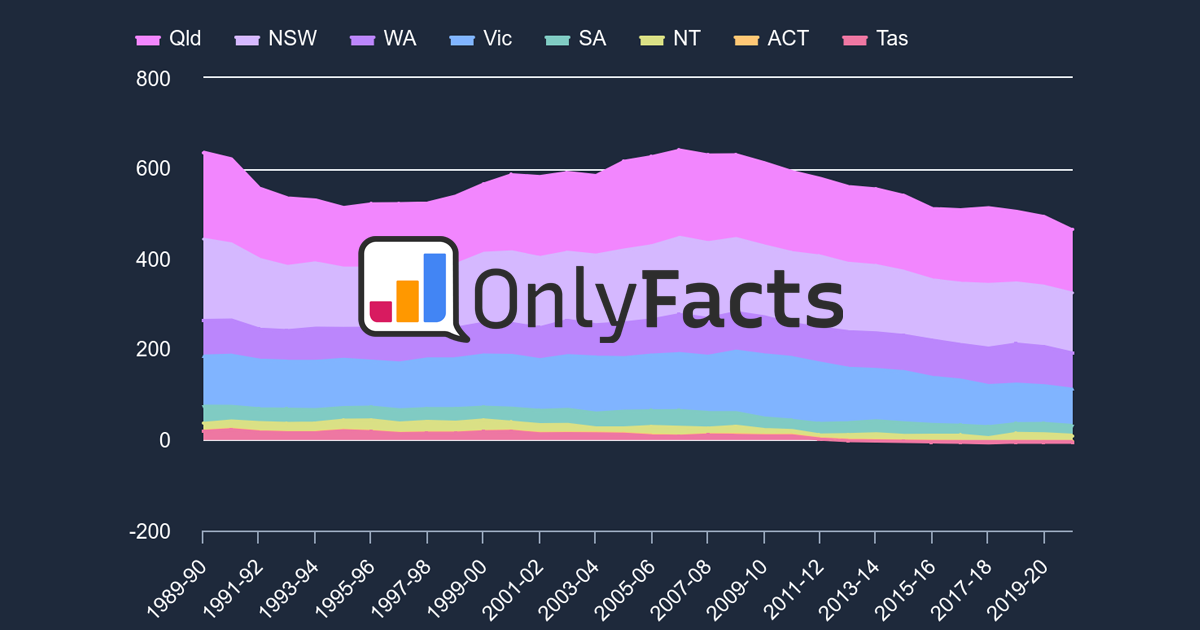
1. Emissions

TAS Emissions

Total Net Emissions

FULL DATA

Explainer

Tasmania has already achieved net-zero emissions.

This is because the state's renewable energy production - particularly hydroelectric power -  exceeds its own energy consumption.

Tasmania aims to maintain its net-zero emissions status and help Australia's overall emissions reduction.

Read more

Data

TAS

Total Net Emissions

YEAR

Mt CO₂-e

NET

v 2005

2013-14 -3.3 1274.0% 121.2%
2014-15 -2.9 12.7% 118.5%
2015-16 -6.4 123.2% 141.3%
2016-17 -2.0 68.5% 113.0%
2017-18 -6.8 235.3% 143.6%
2018-19 -4.4 35.3% 128.2%
2019-20 -5.4 23.9% 134.9%
2020-21 -3.7 32.4% 123.6%
2021-22 -4.3 18.5% 128.0%

Source: DCCEEW via OnlyFacts | Updated: 30-06-22

Trend

TAS

Total Net Emissions

Source: DCCEEW via OnlyFacts | Updated: 30-06-22

Total Gross Emissions

Explainer

When you hear the term 'Net Zero', have you ever thought about what 'Net' means?

It means total emissions put into the atmosphere minus emissions removed from the atmosphere.

So, gross emissions, are the total emissions put into the atmosphere before any removals.

In Australia, only one sector is responsible for both releasing and removing greenhouse gases: Land Use, Land-Use Change and Forestry (LULUCF).

We have removed LULUCF from the total net emissions, as a proxy for Australia's gross emissions.

Trend

TAS

Total Gross Emissions

Source: DCCEEW via OnlyFacts | Updated: 30-06-22

Sector Emissions

Sector Emissions

Explainer

When countries report their emissions, they're divided into sectors. Here are some key terms:

  • Fugitive emissions are released during gas, oil and coal production.
  • Industrial processes mean chemical, metal and mineral production, as well as fridges and air-conditioners.
  • Stationary energy means burning fuel for energy (e.g. gas, coal) in settings other than transport, such as power plants or buildings.

For more, click the Read more button.

Read more

Trend

TAS

Sector Emissions

Source: DCCEEW via OnlyFacts | Updated: 30-06-22

Comparisons

Data

This data's location is different from the page location.

AUS

Comparisons

STATE / TERRITORY

per 100k

Mt CO₂-e

NET

Qld 2.332 124.1 13.4%
NSW 1.359 111.0 2.9%
Vic 1.278 84.7 5.4%
WA 2.957 82.5 12.0%
NT 6.687 16.7 9.4%
SA 0.869 15.8 20.5%
ACT 0.281 1.3 16.3%
Tas -0.760 -4.3 18.5%
Australia 1.663 432.6 1.4%

Source: DCCEEW via OnlyFacts | Updated: 30-06-22

Trend

This data's location is different from the page location.

AUS

Comparisons

Source: DCCEEW via OnlyFacts | Updated: 30-06-22

News

Sign up to the free weekly climate data briefing