1. Road: Data

What is Mt CO₂-e? Emissions are a combination of gases. Most are Carbon Dioxide (CO₂). The other gases are measured as a Carbon Dioxide equivalent (CO₂-e) based on the amount of heat they trap in the atmosphere. They’re measured in Million Tonnes (Mt).

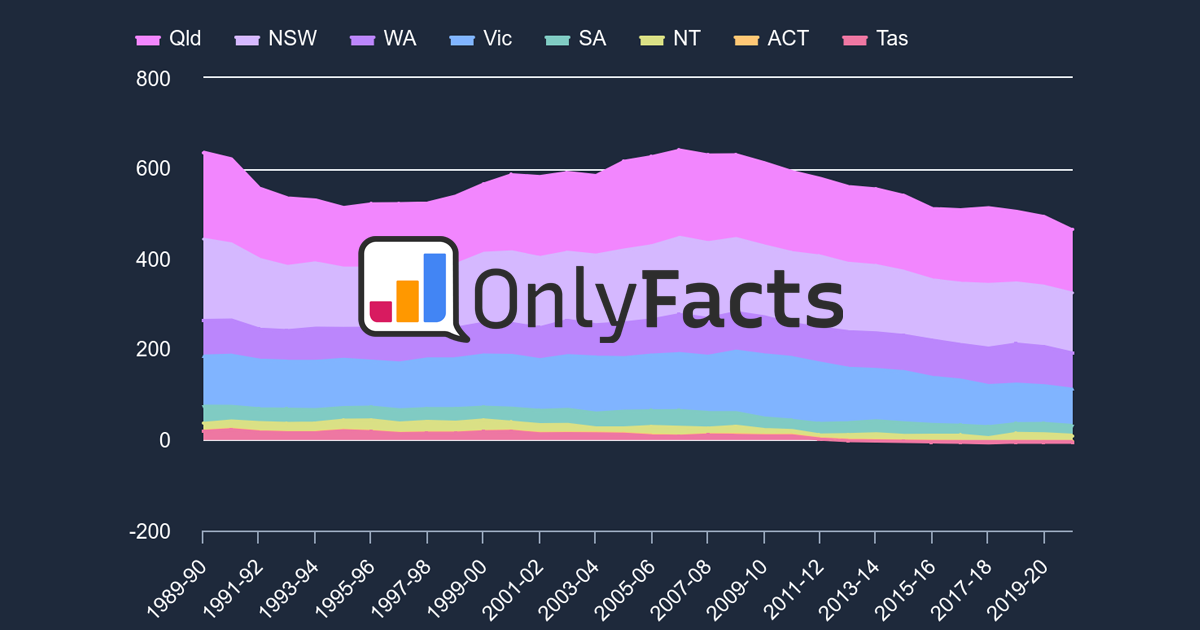
Road

Emissions history

Australia

Source: DCCEEW via OnlyFacts

Data

Emissions History

Australia

YEAR

Mt CO₂-e

NET

1989-90 53.866 -
1990-91 52.984 1.6%
1991-92 53.712 1.4%
1992-93 55.29 2.9%
1993-94 56.703 2.6%
1994-95 58.888 3.9%
1995-96 60.19 2.2%
1996-97 61.134 1.6%
1997-98 62.183 1.7%
1998-99 63.415 2.0%
1999-00 64.684 2.0%
2000-01 64.156 0.8%
2001-02 66.047 2.9%
2002-03 68.614 3.9%
2003-04 71.123 3.7%
2004-05 71.417 0.4%
2005-06 72.534 1.6%
2006-07 73.53 1.4%
2007-08 74.37 1.1%
2008-09 74.909 0.7%
2009-10 76.134 1.6%
2010-11 78.043 2.5%
2011-12 78.448 0.5%
2012-13 79.285 1.1%
2013-14 79.196 0.1%
2014-15 80.805 2.0%
2015-16 81.636 1.0%
2016-17 82.679 1.3%
2017-18 84.45 2.1%
2018-19 84.728 0.3%
2019-20 79.641 6.0%
2020-21 78.641 1.3%
2021-22 76.758 2.4%

Source: DCCEEW via OnlyFacts

News

Sign up to the free weekly climate data briefing